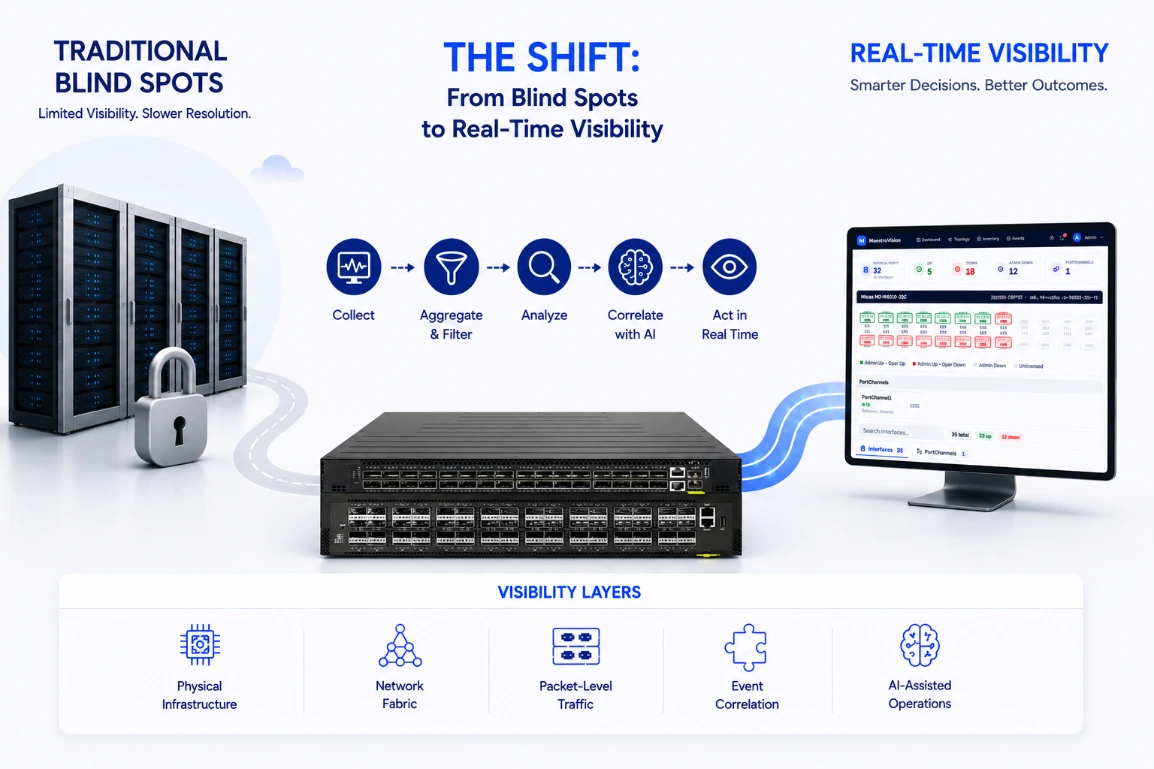
A link can report healthy utilization while an application is already slowing down. That gap between device status and user experience is where high-speed data center incidents become expensive.
At 100G and 400G, a short burst, a bad optic, an uneven ECMP path, or an overloaded monitoring tool can disappear inside an average. Network engineers need enough context to see the event, connect it to the right layer, and verify the cause while it is still happening.
Real-time visibility is not one dashboard. It is a chain of evidence from the physical link to the packet and the application.
Why high-speed fabrics hide problems
Modern data centers carry more east-west traffic, more overlays, and more short-lived flows than the environments traditional polling was built to observe. Virtual workloads can move. VXLAN can separate the path an operator sees from the path a packet takes. AI clusters can produce intense traffic patterns that expose small imbalances quickly.
SNMP, interface counters, CPU readings, and syslog still matter. The problem is using any one of them as a complete explanation.
The five layers engineers need to connect
Useful visibility comes from joining signals that are often owned by different tools or teams. Each layer answers a different part of the incident.
Physical and optical state
Start with what can fail underneath everything else: transmit and receive power, laser temperature, voltage, bias current, fan health, power supplies, and environmental readings.
Question answered: Is the link degrading even though it has not gone down?
Fabric behavior
Track the underlay and overlay together. BGP state, route convergence, link utilization, ECMP distribution, VXLAN tunnels, VNIs, and EVPN routes need a shared timeline.
Question answered: Is the fabric healthy end to end, or only at the interface level?
Packet-level evidence
Use taps, packet brokers, and capture or analysis tools to inspect the traffic itself. Aggregation, filtering, deduplication, replication, decapsulation, and load balancing keep monitoring tools focused on the packets they can process.
Question answered: Who is talking, what is failing, and where does the behavior change?
Event correlation
Align telemetry, traps, syslog, flow data, packet findings, security alerts, and application performance by time and topology. A single optical problem can otherwise look like several unrelated incidents.
Question answered: Which event is the cause, and which events are symptoms?
Analytics and assisted operations
Analytics can establish baselines, surface anomalies, and rank likely causes. Automation can then gather diagnostics or start a controlled response. Both work best when engineers can trace a recommendation back to the underlying evidence.
Question answered: What changed, what should be checked next, and can the response be repeated safely?
Build the path from evidence to action
A visibility architecture should follow the way engineers investigate. Collection comes first. Context and correlation follow. Automation belongs at the end, after the evidence is trustworthy.
-
Acquire the right traffic and telemetry
Collect from taps, SPAN or ERSPAN sessions, switches, routers, firewalls, optical devices, servers, and hypervisors. Use streaming telemetry, gNMI, SNMP, syslog, flow records, and APIs where each is strongest.
-
Condition packet feeds before they reach tools
A network packet broker can aggregate, filter, deduplicate, replicate, and balance traffic. This protects analysis and security tools from irrelevant traffic and oversubscription.
-
Normalize time and topology
Signals only become useful together when timestamps align and systems understand which device, link, VNI, workload, and application belong to the same path.
-
Correlate before escalating
Group symptoms around the first meaningful change. This gives the operations team one incident to investigate instead of several disconnected alerts.
-
Automate repeatable responses
Use APIs, Python, Ansible, NETCONF, or gNMI to collect diagnostics and apply approved actions. Open platforms make this easier because the workflow is not limited to one vendor's management system.
A practical troubleshooting sequence
Consider an AI training job that slows down without a full outage. The useful question is not whether the network is up. It is where the behavior first departs from normal.
- Confirm the symptom. Application latency rises during a specific training phase, while overall fabric utilization still looks acceptable.
- Narrow the path. Flow and fabric data point to traffic crossing one leaf uplink more heavily than its ECMP peers.
- Inspect the packets. The relevant feed shows drops and retransmissions on flows using that path.
- Correlate the physical signal. Receive power on one optic has drifted while interface errors begin to climb.
- Correct and verify. After the physical issue is addressed, path distribution, packet loss, and application latency return to baseline.
The value is not a dramatic claim that every incident takes seconds. It is the removal of handoffs and guesswork between the application, fabric, packet, and physical views.
What belongs on the operator's screen
A useful operational view favors signals that change a decision. More charts do not create more certainty.
| Layer | Signals to keep close | Operational decision |
|---|---|---|
| Physical | Tx/Rx power, temperature, voltage, bias current, environmental state | Repair, clean, replace, or continue observing the link |
| Fabric | BGP neighbors, route convergence, tunnel state, ECMP distribution, errors and discards | Isolate a path, routing event, or capacity imbalance |
| Traffic | Top talkers, flow direction, drops, retransmissions, protocol behavior | Choose the correct packet feed and analysis tool |
| Applications | Latency, response time, workload placement, security findings | Connect network behavior to user or workload impact |
| Operations | Change history, event sequence, owner, response status, time to resolution | Coordinate the response and verify that the fix held |
The goal is faster certainty
High-speed infrastructure does not become manageable because every device produces more telemetry. It becomes manageable when engineers can move from a symptom to the right evidence without rebuilding the story by hand.
That requires physical health, fabric state, packet data, application context, and event history to work as one investigative path. Analytics can shorten that path, and automation can make the response consistent, but neither replaces sound collection and correlation.
The practical test is simple: when performance changes, can the team see where it changed, explain why, and prove that the correction worked?
Take control of your network with real-time visibility across every layer of your infrastructure.
Connect with E.C.I. NETWORKS to explore solutions designed for modern, high-speed data centers.
Contact Our Team