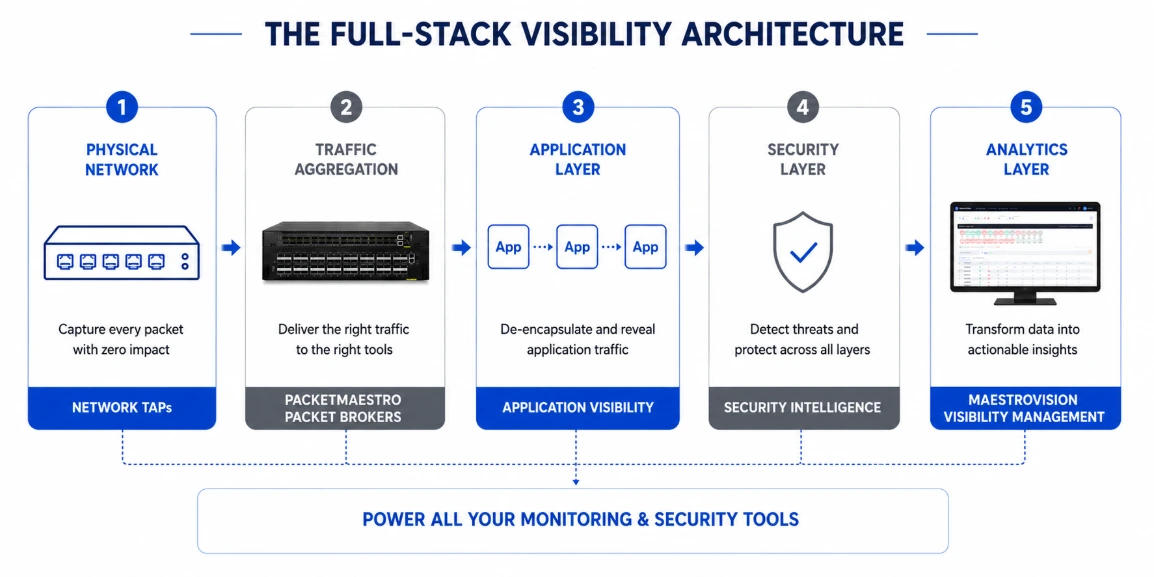
Data centers now carry AI training traffic, cloud-native services, distributed storage, and a growing volume of flows that never touch the perimeter. The networks underneath have scaled faster than the tools used to observe them. Interface counters and device polling still describe how a switch feels, but they say very little about what the traffic is actually doing. Full-stack visibility closes that gap by delivering complete, accurate packet data to every tool that needs it, from the physical layer through applications, security, and analytics. This guide covers what that architecture looks like and how to build one that keeps scaling.
Where Conventional Monitoring Stops
Most monitoring platforms report on the device. They tell you utilization, processor load, memory pressure, and link state. All of that is useful, and none of it explains why one transaction crawled while an identical one did not. The device is healthy. The traffic is where the answer lives.
- Interface utilization and throughput averages
- Processor and memory load
- Link, port, and neighbor state
- Error and discard counters
- Device reachability and uptime
- Which flow caused the microburst that filled the buffer
- Whether a retransmission came from the network or the application
- What a lateral connection between two workloads actually carried
- Whether QoS marking survived every hop in the path
- What the session looked like in the seconds before an alert fired
Applications now spread across bare metal, virtual machines, containers, cloud workloads, and edge sites. Visibility has to follow them across all of it, which makes this an architectural problem rather than a question of buying one more probe.
The Visibility Stack, Layer by Layer
Full-stack visibility is built from five layers that each depend on the one below it. Weakness at the bottom cannot be corrected higher up.
Physical Capture
Network TAPs
Everything downstream depends on obtaining a faithful copy of the traffic. A passive TAP sits in the link and reproduces both directions with no impact on the production path, no oversubscription during congestion, and timing precise enough for latency analysis. Once a TAP is installed, that link stays observable without another maintenance window.
Traffic Aggregation
Packet Brokers
At 100G and above, sending every packet to every tool stops being affordable and eventually stops being possible. A packet broker sits between capture and tools and decides what each tool receives, so an analyzer rated for a fraction of the fabric still sees everything relevant to its job.
Application Context
Encapsulation handling
Traffic rarely arrives in a shape tools recognize. Modern sessions run over HTTP/2, HTTP/3, QUIC, and gRPC, then travel wrapped inside overlay and transport encapsulations. Removing tunnel headers while preserving the metadata lets existing tools inspect the original session instead of inferring it.
Security Intelligence
NDR, IDS, forensics
Detection platforms are only as accurate as the traffic they receive. Gaps cause missed detections and false positives at the same time, because a partial session looks anomalous on its own. Complete packet delivery is what lets these tools distinguish real activity from artifacts of their own input.
Operation Analytics
Correlation and planning
The top layer turns packets into decisions. Correlating network events with application behavior, infrastructure health, and historical trends means troubleshooting starts from evidence, and capacity planning is based on how the fabric is actually used rather than on how it was expected to be used.
On SPAN ports. A mirror port is a switch feature competing with forwarding for the same silicon and buffers. A TAP is a dedicated copy of the link. Under congestion, which is precisely when the data matters most, the mirror is the first thing to drop frames.
Traffic Used to Leave the Building. Most of It No Longer Does.
Perimeter monitoring was designed for an era when the interesting traffic crossed a boundary you controlled. Today the dominant flows run sideways between workloads that sit a rack apart, and none of them pass a firewall or an edge router on the way.
AI Fabrics Change the Requirements
GPU clusters generate more east-west volume than any workload that came before them, and they are unusually sensitive to what the network does with it. Collective operations synchronize across every node, so a single congested path slows the whole job. Microbursts, incast, and a small amount of added latency turn directly into reduced training throughput.
Visibility on these fabrics has to keep pace with the fabric itself. Sampling is not enough when the event you are chasing lasts microseconds, which puts hard requirements on capture fidelity, timestamp precision, and the ability to analyze at line rate rather than after the fact.
Speeds in the Same Room
Very few sites run a single speed. Access, aggregation, storage, and AI fabrics tend to sit at different points on this range, and they all need to reach the same set of tools. The visibility layer has to aggregate across every one of them without becoming the bottleneck it was installed to expose.
Building the Visibility Fabric
A visibility architecture is a path rather than a product. A packet is copied off the wire, reduced to what is worth forwarding, delivered to the tools that can act on it, and the whole arrangement is controlled from one place. Each stage exists so the next one stays manageable as the network grows.
Capture
Passive TAPs copy both directions of a link without touching the production path.
Reduce
Packet brokers cut the stream down to traffic that is worth forwarding.
Deliver
One source feeds every tool, each receiving the share it can process.
Control
The fabric is configured, monitored, and changed from a single interface.
Where TAPs belong
- Core and spine uplinks
- Leaf aggregation
- Internet edge
- Storage fabrics
- Security boundaries
What PM does
- Rule-based filtering
- Duplicate removal
- Packet slicing
- Header stripping
- Tunnel decapsulation
Who gets the traffic
- NDR platforms
- IDS and IPS
- Performance monitor
- Capture and forensics
- SIEM collectors
What MV covers
- Device discovery
- Flow visualization
- Policy deployment
- Health monitoring
- Multi-site rollout
Notes:
- PM stands for PacketMaestro
- MV stands for MaestroVision
The order is what makes it work. Capture added after the fact means opening links that are already carrying production traffic. Reduction placed too late means tools have already been sized for volume they never needed to see. A fabric built without central control turns into a collection of devices that one person understands and nobody else can safely change.
Questions Worth Asking Before You Commit
Most visibility deployments are limited by a decision made early, not by the hardware. These are the questions that tend to matter two years in.
Does it grow from a handful of links to thousands?
Scale should mean adding capacity to an existing fabric, not replacing it. Check how the platform behaves at the point where a single chassis is no longer enough, because that is where architectures usually break.
What happens when hardware fails?
Two separate answers are needed here. Production traffic must survive a failure in the visibility path, and monitoring itself should degrade gracefully rather than going dark during the incident you most want recorded.
Does it hold line rate under real load?
A visibility layer that drops packets when the network is busy reintroduces the exact blind spot it was bought to remove. Performance claims are worth verifying with the packet sizes and filter counts you actually run.
Does it understand the encapsulations you run?
Overlay traffic is normal now. If the platform cannot see inside these headers, everything above it inherits the limitation. VXLAN Geneve MPLS GTP ERSPAN GRE
Can existing tools be reused?
Tool independence protects investments already made. A visibility fabric that quietly requires a matching analytics suite has moved the lock-in rather than removed it.
Can it be driven by automation?
Anything configured by hand eventually drifts. REST APIs and integration with the automation and orchestration frameworks already in use keep policy consistent as the environment changes.
Where PacketMaestro Fits
E.C.I. NETWORKS builds the aggregation and distribution layer of this architecture with PacketMaestro and PacketMaestro-PRO. Both sit between capture and tools, and both are designed to hold line rate while doing the work that keeps monitoring appliances useful at high speed.
MaestroVision
Central management for the fabric. Devices are discovered automatically, traffic flows are visualized, policies are created once and applied across sites, and health is monitored from a single interface rather than device by device.
What Changes Once It Is In Place
The value of a visibility fabric shows up in how ordinary work gets done, long after the deployment itself is forgotten.
Troubleshooting starts from evidence
Instead of correlating counters and forming a theory, the team opens the session and reads what happened.
Blind spots close
East-west, encapsulated, and inter-tenant traffic becomes visible to the security tools already deployed.
Tools cost less to scale
Filtering and load balancing mean appliances process traffic they need, so capacity is added where it earns something.
Growth stops being disruptive
New links and faster speeds attach to the existing fabric rather than triggering another monitoring redesign.
Audits get simpler
Retention and compliance requirements are served from one consistent traffic source instead of assembled per system.
Operations consolidate
Central policy and automation replace per-device configuration, which is what keeps a large fabric maintainable.
The Bottom Line
As data centers move toward AI-driven, cloud-native, and widely distributed architectures, visibility stops being an operational add-on and becomes a design principle. It belongs in the drawings alongside power, cooling, and cabling, because retrofitting it into a live fabric is far more expensive than planning it in.
The Takeaway
Passive TAPs for faithful capture, intelligent packet brokers such as PacketMaestro and PacketMaestro-PRO for reduction and distribution, and MaestroVision for central control. Together they form a fabric that scales with the network and gets more value out of the monitoring and security tools already in place.
Every packet in a modern data center carries operational intelligence. Full-stack visibility is what makes that intelligence available to the people responsible for keeping the environment fast, secure, and predictable.
Build High-Performance Data Centers with Complete Visibility
Gain full-stack insights, optimize performance, and secure every layer of your network.
Contact Our Team